Independent Retailer Planogram Generation
Leveraging Maxerience PicToPog Products To Scale POG Generation
The Problem
Brands simply don’t have access to Retailer generated planograms. In some retailers and locations, there are no planograms at all, especially prevalent in the independent retail outlets such as bodegas, coffee shops and convenience stores. Even major chains hold on to POG, not distributing files to vendors. CPGs are blind to final planograms published to each store. As retailers adjust assortment and category size for each store, the difficulty CPG’s have in gathering each planogram is real, time consuming and costly. Begging field sales to manually capture store level planograms needed to build a planogram into Blue Yonder or Relex software is unproductive and unrealistic. Asking for a picture of the shelf doesn’t help much since only a few stores might be captured.
There can only be one Category Advisor to a retailer, and they have all of the planograms. Everyone else is left with building their own, trying to determine how their brands are being represented and to make sure stores execute effectively.
Why?
The Planogram is everything when it comes to the Bricks and Mortar retail landscape. Operationally, this store level document drives what items need to be ordered and merchandised in the store. Strategically, this document reflects how a Retailer believes they can maximize their category to attract and close shoppers winning share from their Retailer competition. Ultimately for CPG’s, this is the scorecard by which their sales, category and brands teams are measured for their efforts.
Solution
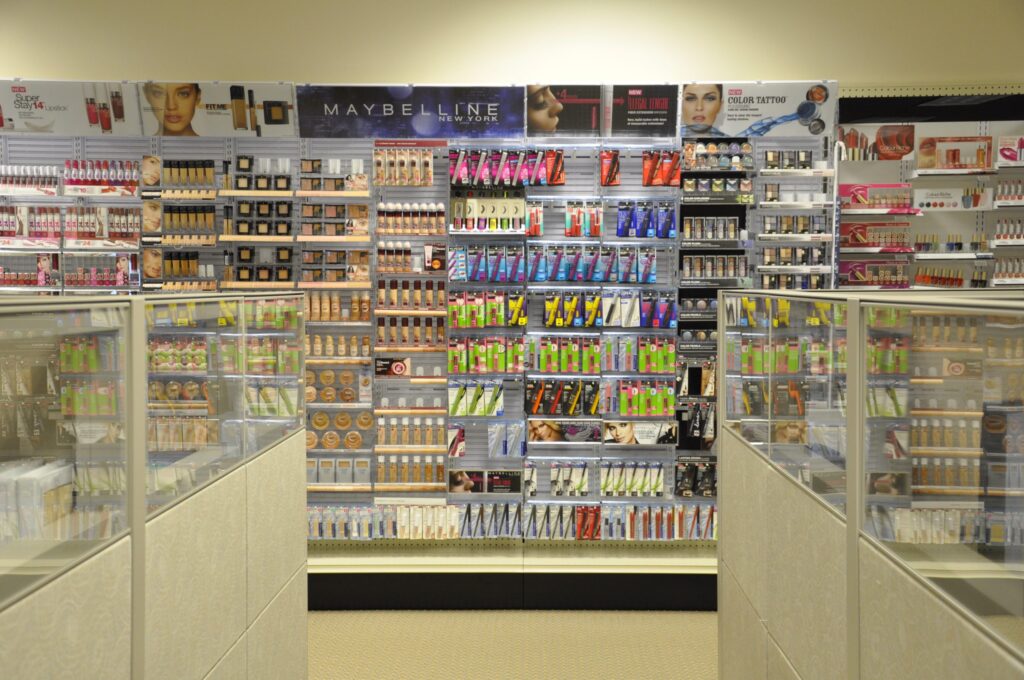
Maxerience, a Vision Group company, has developed PicToPog. This cutting-edge tool combines AI-Image Recognition, state-of-the-art Image Catalog, and strategic relationships with the largest Planogram software companies in Blue Yonder and Relex to create editable Planograms from a photo captured at shelf. We call this a “Real-O-Gram” that is a planogram that reflects what the planogram looks like at store level- now.
How it works?
The “Real-O-Gram” is captured at store level with a simple photo. Once captured, there are many ways the “Real-O-Gram” is leveraged by CPGs and Distributors. These are the three most popular.
Compliance. Compare the “Real-O-Gram” with what was expected or the Planogram to see gaps. Given AI algorithms are doing the comparing, compliance can be scaled across very store at a retail chain, a Sales Rep Territory or a Sales Region. Many CPG’s score compliance and compare across sales organizations or regions determine performance. Others use these gaps to drive execution with their field teams to close gaps.
Competitive Analysis and Planogram ROI. CPG’s will integrate point of sale data to develop a store level “cause and effect” analysis of their brands. What is the impact of my brand at eye level? What sales lift do I get when a multi-pack is in the planogram? What impact did moving my brands to the right of the planogram vs. the left side? These are a sample of questions that can now be answered across each store, a cluster of stores or a region.
Non-measured Retailer Visibility. Foodservice organizations understanding how open air coolers are merchandised, Independent Convenience Stores where store managers develop their own planograms, and chains that simply only supply planograms to their top suppliers.
Benefits
- “Real-O-Gram” Creation from a photo in real time
- “Real-O-Gram” converted to Relex and Blue Yonder planograms
- Drive Planogram compliance and competitive analysis at scale